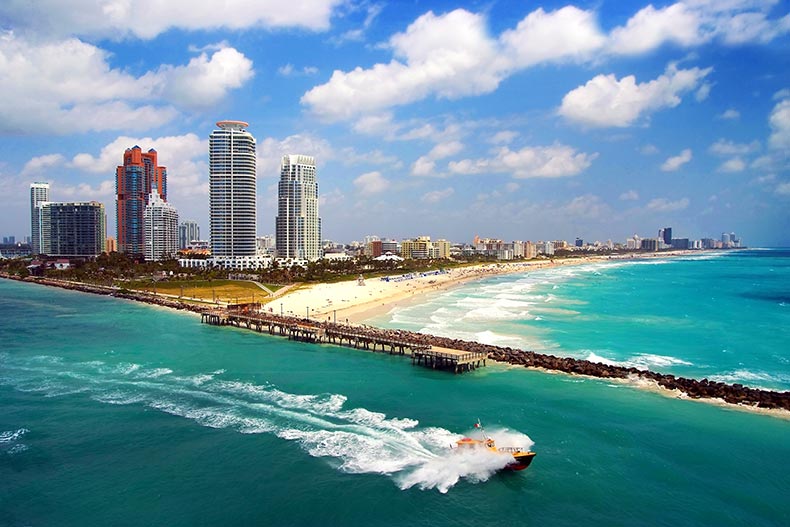
Florida continues to be the largest market in the 55+ real estate industry. More than 50% of all MLS listings in the U.S. in February 2024 were in the Sunshine State. Southeast Florida, which includes Miami-Dade and Broward Counties, had by far the most listings, at nearly 3,800. Following SE Florida, the other areas with significant homes available include the Central Florida region, Fort Myers–Naples, and Tampa Bay.
Florida 55+ Market Data: Key Takeaways
List prices in Florida are lower than in many other parts of the country with abundant supply. Other than Fort Myers-Naples, the other three popular areas have average list prices in the $330k – $350k range. Sales have been steady. However, the plentiful supply has led to nearly five months of inventory in Tampa. Other regions generally have 6 – 8 months of inventory. On the sales side, sales prices are running at about 3% below the list.
The Villages, Sun City Center, On Top of the World, and The Villages of Citrus Hills had the most sales in February. Of the 20 communities with 20 or more sales, prices increased compared to January 2024 in 18 of the 20. Also, the total units sold grew in all but one.
| Market Area | Average Daily Active Listing Count | Median Listing Price | Median Days On Market | Average Of 30 Days Sum Of Total Closed Listings | Median Sales Price | Days Inventory |
| Central Atlantic Coast | 637 | $432,450 | 78 | 72 | $425,000 | 8.85 |
| Central Florida | 2,429 | $334,450 | 67 | 490 | $336,250 | 4.96 |
| Central Gulf Coast | 1,276 | $399,900 | 64 | 200 | $502,500 | 6.38 |
| Daytona Beach | 483 | $431,000 | 64 | 95 | $447,370 | 5.08 |
| Florida Panhandle | 70 | $495,000 | 151 | 6 | $991,500 | 11.67 |
| Fort Myers–Naples | 1,815 | $572,500 | 54 | 223 | $627,500 | 8.14 |
| Jacksonville | 305 | $459,000 | 61 | 35 | $431,980 | 8.71 |
| Southeast Florida | 3,794 | $342,500 | 53 | 498 | $264,000 | 7.62 |
| Tampa | 1,518 | $339,900 | 63 | 319 | $331,250 | 4.76 |
| FLORIDA TOTAL | 12,327 | $392,264 | 61 | 1938 | $380,033 | 6.36 |
Market Trends in Top 20 Communities By Sales in Florida
| Name | Feb 2024 Listings | Δ vs. Jan 2024 | Feb 2024 Median Listing Price | Δ vs. Jan 2024 | Feb 2024 Median Days On Market | Δ vs. Jan 2024 | Feb 2024 Closings | Δ vs. Jan 2024 | Feb 2024 Median Sales Price | Δ vs. Jan 2024 | Months of Inventory | Δ vs. Jan 2024 | ||||||
| The Villages | 444 | 3.3% | ▲ | 370 k | 1.3% | ▼ | 51 | 3 | ▼ | 122 | 7.0% | ▲ | 366 k | 1.2% | ▲ | 3.6 | 0.1 | ▼ |
| Sun City Center | 279 | 2.6% | ▲ | 300 k | 0.0% | ▼ | 69 | 1 | ▲ | 59 | 20.4% | ▲ | 320 k | 2.2% | ▲ | 4.7 | 0.8 | ▼ |
| On Top of the World | 195 | 4.3% | ▲ | 307 k | 0.2% | ▼ | 75 | 2 | ▼ | 36 | 20.0% | ▲ | 283 k | 7.3% | ▲ | 5.4 | 0.8 | ▼ |
| The Villages of Citrus Hills | 199 | 2.6% | ▲ | 453 k | 0.5% | ▼ | 79 | 0 | ▼ | 35 | 12.9% | ▲ | 400 k | 4.3% | ▼ | 5.7 | 0.6 | ▼ |
| Century Village at Pembroke Pines | 177 | 8.6% | ▲ | 250 k | 0.0% | ▼ | 60 | 1 | ▲ | 29 | 20.8% | ▲ | 212 k | 0.9% | ▼ | 6.1 | 0.7 | ▼ |
| Century Village at West Palm Beach | 246 | 7.0% | ▲ | 139 k | 0.0% | ▼ | 62 | 2 | ▼ | 29 | 7.4% | ▲ | 124 k | 0.8% | ▼ | 8.5 | 0.0 | ▼ |
| Kings Point | 131 | 6.5% | ▲ | 249 k | 0.2% | ▼ | 64 | 2 | ▲ | 29 | 20.8% | ▲ | 207 k | 6.9% | ▼ | 4.5 | 0.6 | ▼ |
| Kings Point in Delray Beach | 327 | 6.9% | ▲ | 165 k | 0.0% | ▼ | 67 | 2 | ▲ | 24 | 4.0% | ▼ | 135 k | 3.9% | ▼ | 13.6 | 1.4 | ▲ |
| Angeline | 26 | 7.1% | ▼ | 415 k | 2.8% | ▲ | 34 | 12 | ▼ | 21 | 0.0% | ▼ | 406 k | 0.9% | ▼ | 1.2 | 0.1 | ▼ |
| Halifax Plantation | 91 | 1.1% | ▲ | 565 k | 0.3% | ▲ | 71 | 9 | ▼ | 21 | 0.0% | ▼ | 391 k | 1.0% | ▼ | 4.3 | 0.0 | ▲ |
| Oak Run | 70 | 1.4% | ▼ | 250 k | 1.2% | ▼ | 64 | 6 | ▼ | 21 | 5.0% | ▲ | 261 k | 2.4% | ▼ | 3.3 | 0.2 | ▼ |
| Solivita | 93 | 3.1% | ▼ | 340 k | 0.0% | ▲ | 106 | 3 | ▲ | 21 | 23.5% | ▲ | 390 k | 19.1% | ▲ | 4.4 | 1.2 | ▼ |
| Southshore Bay | 29 | 0.0% | ▼ | 399 k | 0.0% | ▼ | 36 | 6 | ▼ | 21 | 31.3% | ▲ | 386 k | 7.7% | ▲ | 1.4 | 0.4 | ▼ |
| Venetian Bay | 72 | 9.1% | ▲ | 444 k | 0.5% | ▲ | 49 | 14 | ▼ | 21 | 16.7% | ▲ | 434 k | 2.8% | ▲ | 3.4 | 0.2 | ▼ |
| Century Village East | 210 | 6.6% | ▲ | 157 k | 0.9% | ▲ | 52 | 7 | ▼ | 20 | 11.1% | ▲ | 153 k | 0.7% | ▼ | 10.5 | 0.4 | ▼ |
| Century Village at Boca Raton | 214 | 4.9% | ▲ | 180 k | 0.6% | ▼ | 67 | 2 | ▲ | 18 | 0.0% | ▼ | 156 k | 2.5% | ▲ | 11.9 | 0.6 | ▲ |
| Wynmoor Village | 133 | 3.1% | ▲ | 220 k | 0.0% | ▲ | 69 | 2 | ▲ | 18 | 12.5% | ▲ | 165 k | 8.8% | ▼ | 7.4 | 0.7 | ▼ |
| Kings Point in Tamarac | 108 | 6.9% | ▲ | 250 k | 2.9% | ▼ | 55 | 0 | ▼ | 17 | 6.3% | ▲ | 239 k | 0.0% | ▼ | 6.4 | 0.0 | ▲ |
| Villages of Oriole | 141 | 7.6% | ▲ | 245 k | 1.6% | ▼ | 63 | 3 | ▲ | 15 | 6.3% | ▼ | 220 k | 1.1% | ▼ | 9.4 | 1.2 | ▲ |
| On Top of the World Clearwater | 92 | 3.4% | ▲ | 215 k | 1.1% | ▲ | 71 | 4 | ▲ | 14 | 6.7% | ▼ | 180 k | 0.0% | ▼ | 6.6 | 0.6 | ▲ |
- Insights and market stats
- Instant new home alerts
- Answers from local 55+ experts